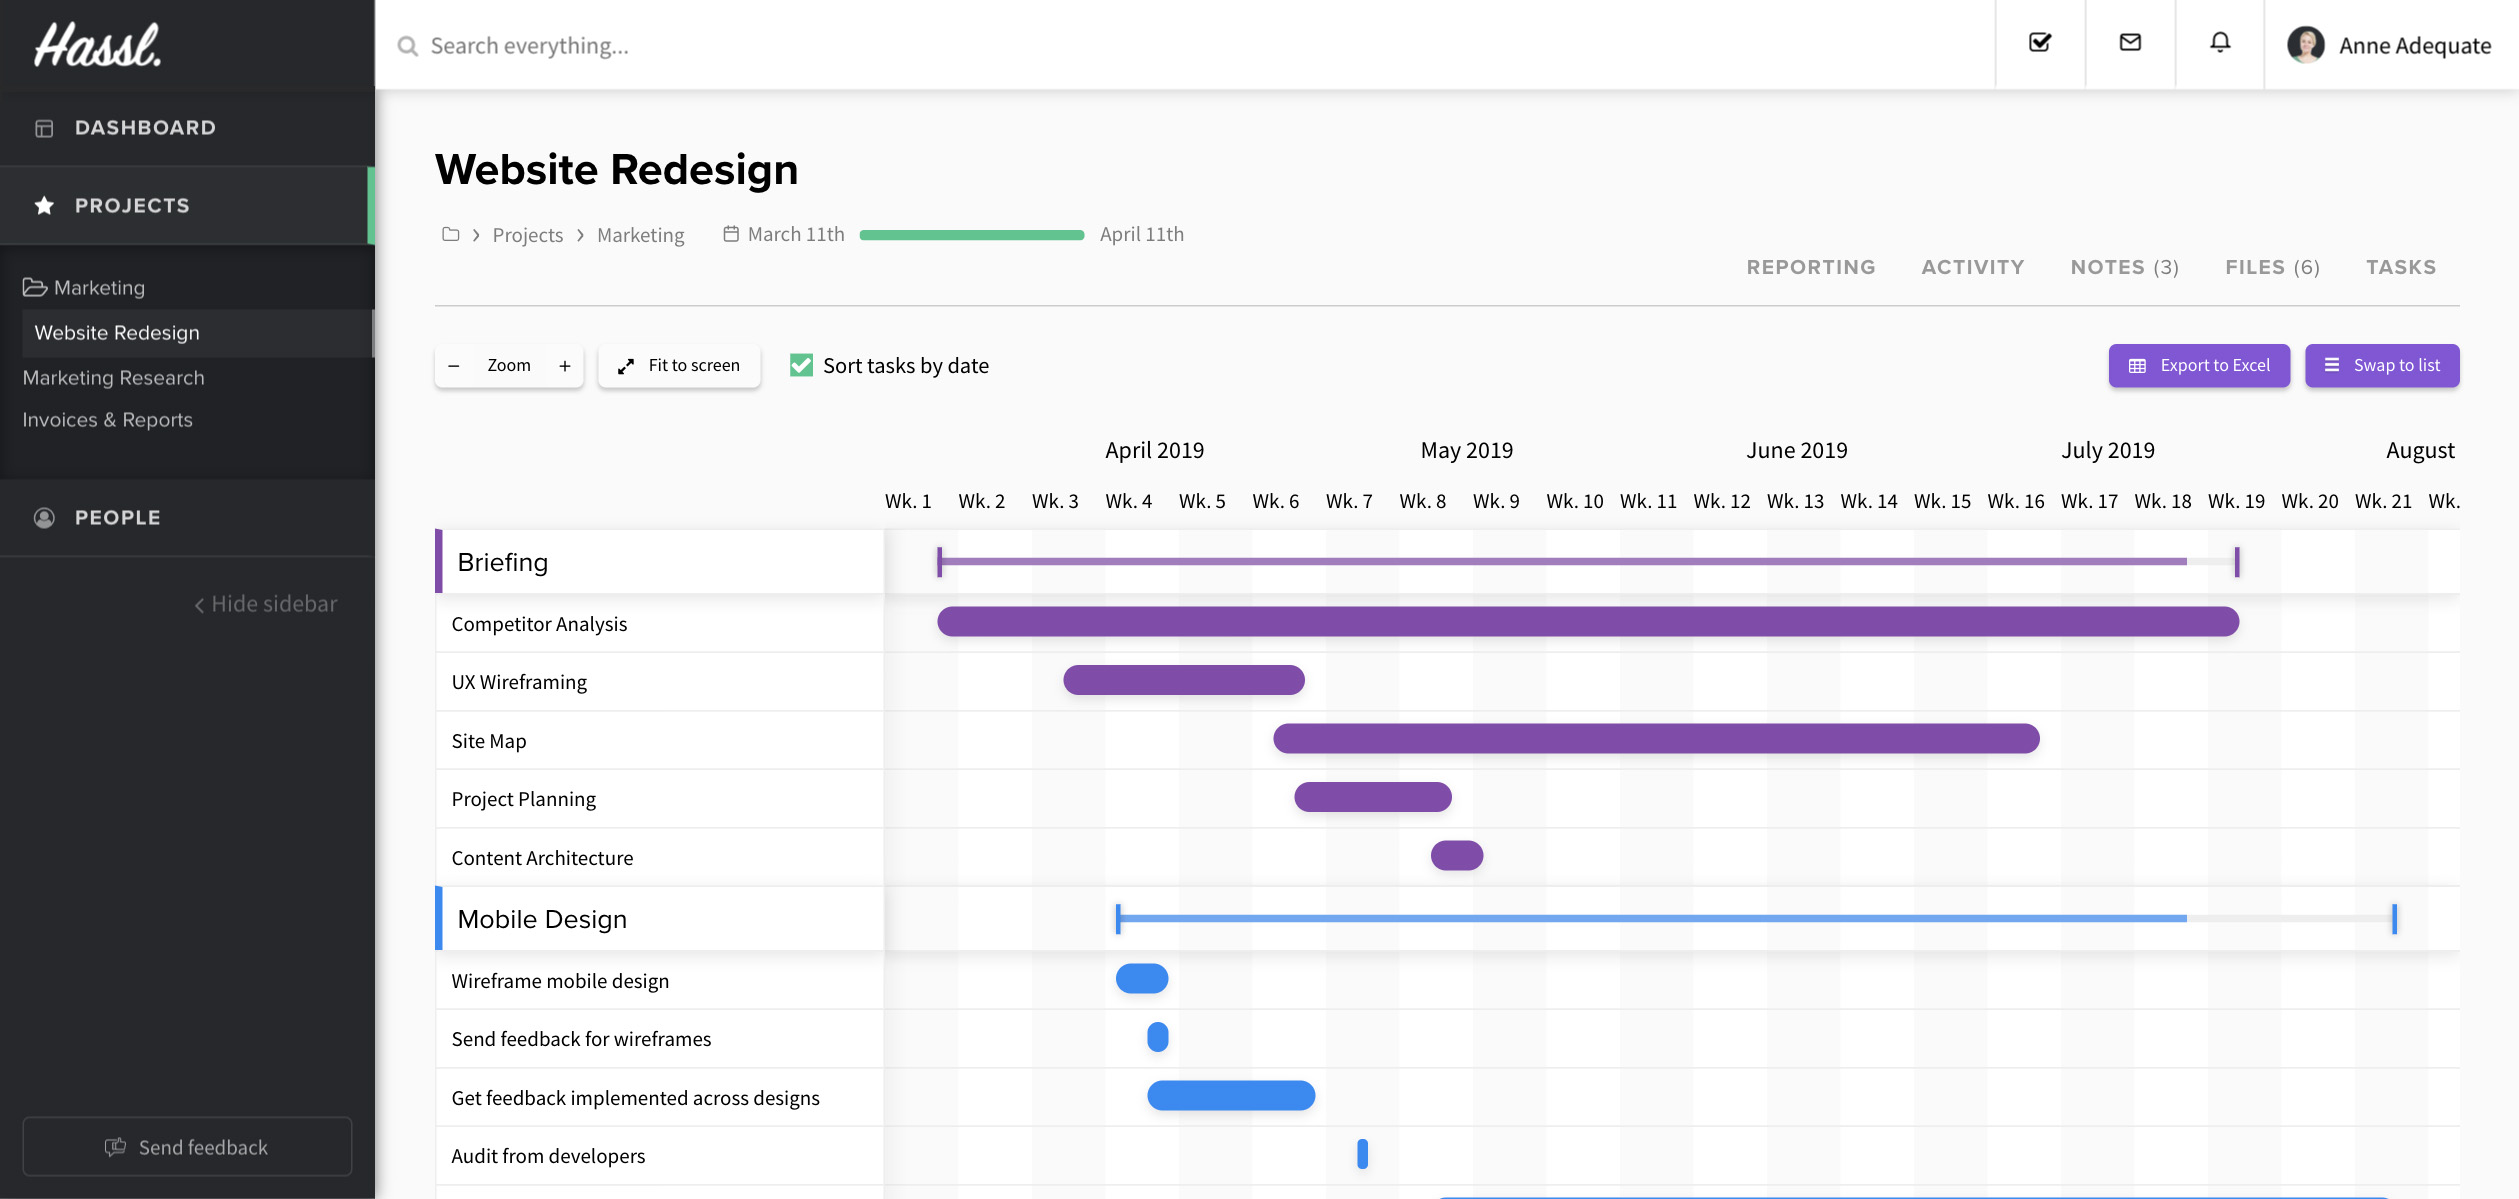
Create smooth workflow management for your team and meet project deadlines on time with Gantt charts.
When you switch to Hassl, every project gains the ability to toggle a simple Gantt chart off or on. It’s all part of your plan! There’s no need to pay for additional integrations or for an upgraded plan. We have one plan with no extra frills — it’s everything you’d ever need in one place.
Customise each project, with the best tool for Gantt charts on the market. Switch between the project time chart view or the task list view with ease. If needed, you can export it to a CSV spreadsheet too.
Finally, a simple project management tool to handle your projects and tasks.

What is a Gantt Chart and why is it important?
In simple terms, it is a visual representation of your project in a timeline. They help teams see how deadlines can be met, which areas need more time, focus or team members, and allow project managers to keep a tab on the completion rate of a project. They also help reduce the likelihood of procrastination, giving a team fixed deadlines and an understanding of what their weekly task flow will look like.
Why use a Gantt Chart?
1. With a Gantt chart, project and time management is a breeze.
Meeting deadlines is critical, especially when you’ve got multiple people who are reliant on co-workers completing tasks before they can begin their own. When you create Gantt charts on Hassl, you can set due dates in accordance with deadlines, making sure to account for an anomaly. Keep your team well informed and get an overview of everyone’s tasks with Project Reports and Time Tracking, to make sure everything is right on schedule.
2. More deadlines met due to increased coordination via visualisation.
Assign tasks to relevant team members involved in each project with ease. When everyone can see a visual representation of each project, co-workers gain motivation to complete tasks on time. Task dependencies within Gantt charts build relationships between tasks. Hence, team members begin to understand why they need to complete tasks by a certain deadline, enabling them to work towards that as motivation.
3. Prevent burnout by utilising flexible task management.
When working on multiple projects, a planning tool helps prevent potential employee burnout. With Hassl’s Gantt chart, building out a project plan has never been easier. Combined with time tracking and project reports, you gain an understanding of how many hours employees can actually put in, where to make adjustments and how to actively optimise to meet deadlines.
4. Keep clients in the loop.
A Gantt chart is a great tool for visualisation for clients too. Use it as a planning tool to help clients gain a better understanding of when to expect results and project updates. Go over which tasks will require more time and why to ensure there’s little to no miscommunication about deadlines. With free guest access on Hassl, that’s easily done!
Still not convinced? Check out the Top 10 Benefits of a Gantt Charts, which include Clarity, Communication, Motivation, Coordination, Creativity, Time Management, Flexibility and Manageability.
How to enable a Gantt Chart for Project Timeline
When you first create a project, you will see a list of toggled options on the right-hand side. Simply flick it to turn Gantt Charts on and remember to save your changes.
![]()
Swap between views — Gantt Chart vs. Project Tasklist
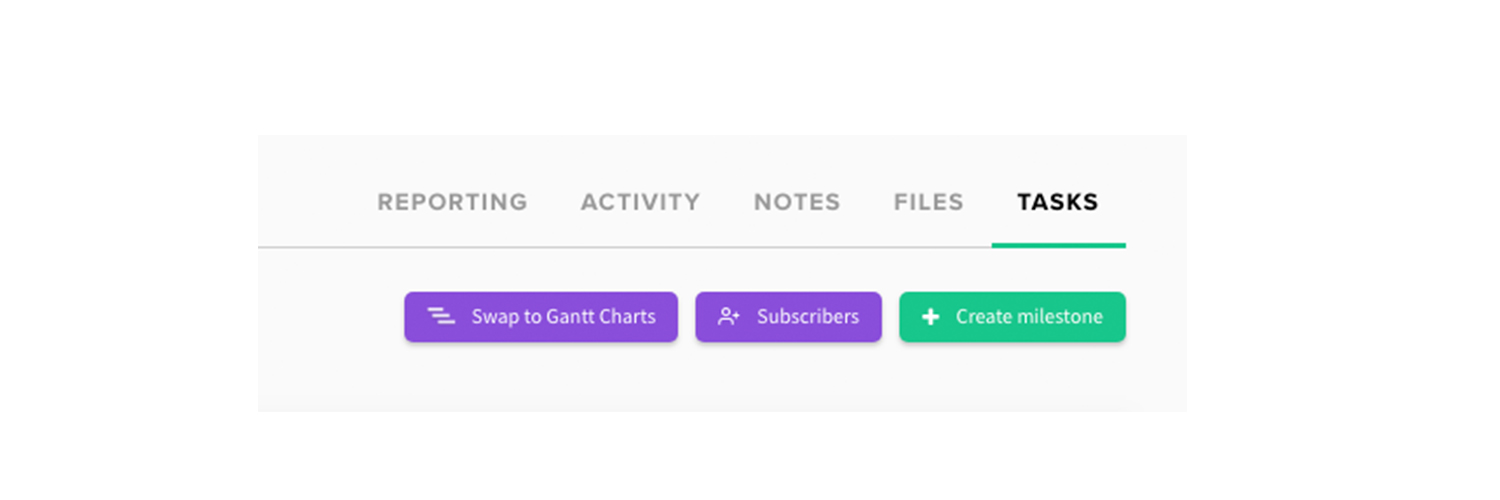
Once you have enabled Gantt Charts for your project, you will see a purple button appear above your list of tasks. You can now switch between your task list view and project timeline view. For your project timeline to work correctly, you will need to enter start and finish dates for each of your tasks.

How to Export Gantt Charts
To export to Excel, simply click the ‘Export to Excel’ button.

Keen to try it for yourself? Start your free trial on Hassl or jump on our standard plan today.
Learn about more of our features on our blog here.


